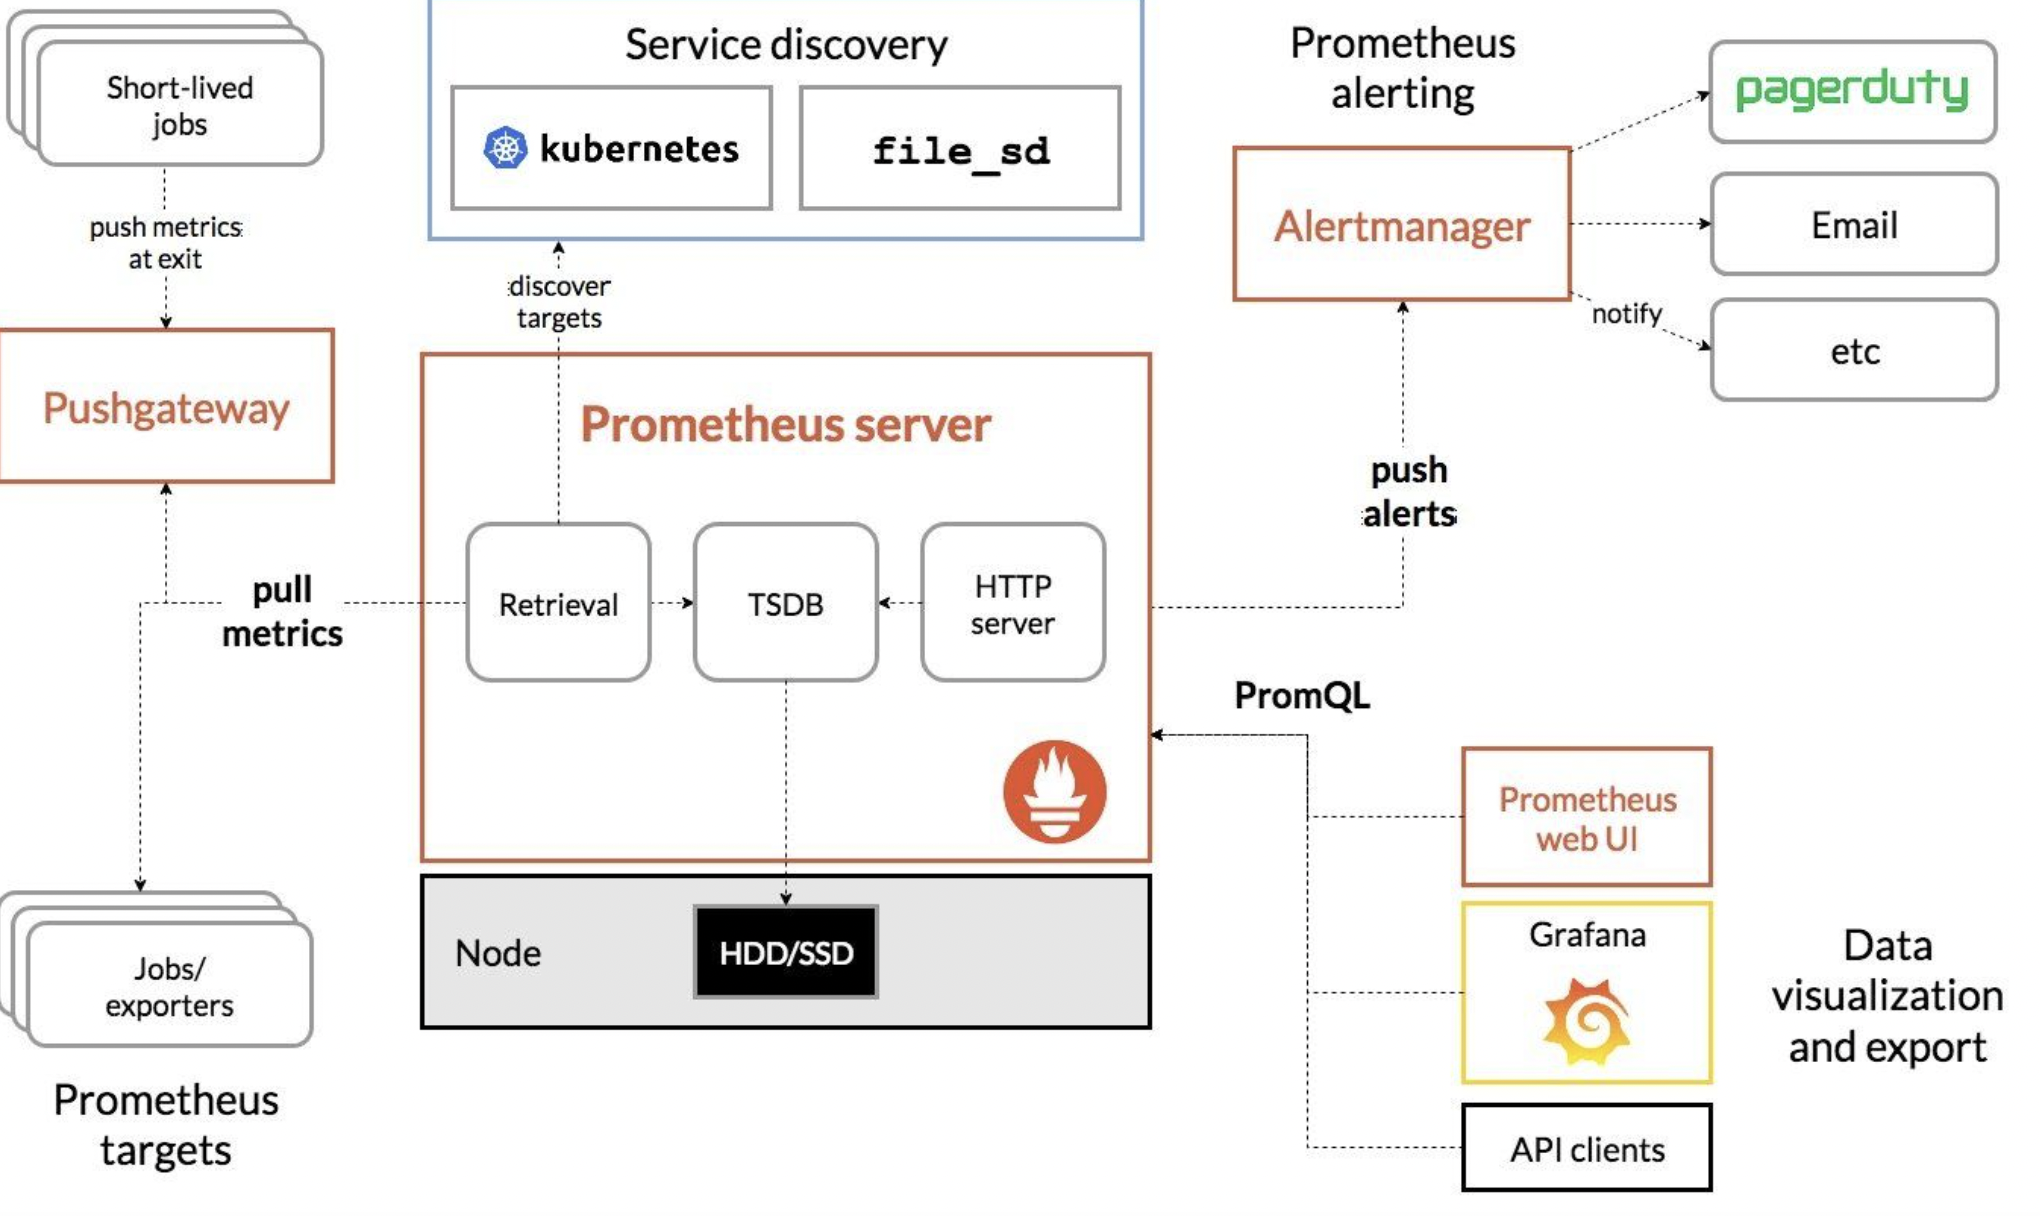
部署prometheus
材料准备
- prometheus安装包:https://github.com/prometheus/prometheus/releases/download/v2.33.1/prometheus-2.33.1.linux-amd64.tar.gz
准备安装
解压安装包,得到如下目录结构:

运行prometheus
1
./prometheus --config.file=your_config.yml
配置文件
这是默认自带的配置文件
1
2
3
4
5
6
7
8
9
10
11
12
13
14
15
16
17
18
19
20
21
22
23
24
25
26
27
28
29
30
# my global config
global:
scrape_interval: 15s # Set the scrape interval to every 15 seconds. Default is every 1 minute.
evaluation_interval: 15s # Evaluate rules every 15 seconds. The default is every 1 minute.
# scrape_timeout is set to the global default (10s).
# Alertmanager configuration
alerting:
alertmanagers:
- static_configs:
- targets:
# - alertmanager:9093
# Load rules once and periodically evaluate them according to the global 'evaluation_interval'.
rule_files:
# - "first_rules.yml"
# - "second_rules.yml"
# A scrape configuration containing exactly one endpoint to scrape:
# Here it's Prometheus itself.
scrape_configs:
# The job name is added as a label `job=<job_name>` to any timeseries scraped from this config.
- job_name: "prometheus"
# metrics_path defaults to '/metrics'
# scheme defaults to 'http'.
static_configs:
- targets: ["localhost:9090"]下面是我部署时的配置文件
1
2
3
4
5
6
7
8
9
10
11
12
13
14
15
16
17
18
19
20
21
22
23
24
25
26
27
28
29
30
31
32
33
34
35
36
37
38
39
40
41
42
43
44
45
46
47
48
49
50
51
52
53
54
55
56
57
58
59
60
61
62
63
64
65
66
67
68
69
70
71
72
73
74
75
76
77
78
79
80
global:
scrape_interval: 15s # Set the scrape interval to every 15 seconds. Default is every 1 minute.
evaluation_interval: 15s # Evaluate rules every 15 seconds. The default is every 1 minute.
# scrape_timeout is set to the global default (10s).
# Load rules once and periodically evaluate them according to the global 'evaluation_interval'.
rule_files:
- "rules/*_rule.yml"
# - "first_rules.yml"
# - "second_rules.yml"
alerting:
alertmanagers:
- static_configs:
- targets:
- 172.26.42.215:9093
# A scrape configuration containing exactly one endpoint to scrape:
# Here it's Prometheus itself.
scrape_configs:
# The job name is added as a label `job=<job_name>` to any timeseries scraped from this config.
- job_name: 'prometheus'
http_sd_configs:
- url: http://172.16.62.99:12000/prometheus/getTargetByType?exporterType=PROMETHEUS
refresh_interval: 5s
- job_name: 'node'
http_sd_configs:
- url: http://172.16.62.99:12000/prometheus/getTargetByType?exporterType=NODE
refresh_interval: 5s
- job_name: 'redis'
http_sd_configs:
- url: http://172.16.62.99:12000/prometheus/getTargetByType?exporterType=REDIS
refresh_interval: 5s
- job_name: 'mysql'
http_sd_configs:
- url: http://172.16.62.99:12000/prometheus/getTargetByType?exporterType=MYSQL
refresh_interval: 5s
- job_name: 'cadvisor'
http_sd_configs:
- url: http://172.16.62.99:12000/prometheus/getTargetByType?exporterType=CADVISOR
refresh_interval: 5s
- job_name: minio-job
bearer_token: eyJhbGciOiJIUzUxMiIsInR5cCI6IkpXVCJ9.eyJleHAiOjQ3ODczNjE1MDEsImlzcyI6InByb21ldGhldXMiLCJzdWIiOiJtaW5pb2FkbWluIn0.Sw6Mcmwmx8J3-uU2MAX3BCmMOZyQuugWmwcjE4a2tJ66d8ZG7n85xZBd7kv33iQFz9l5d3ZOoKQi2KvJNd0Klw
metrics_path: /minio/v2/metrics/cluster
scheme: http
static_configs:
- targets: ['172.18.40.91:9000']
- job_name: 'k8s-node'
static_configs:
- targets: ['172.18.40.81:32222']
- job_name: 'blackbox-exporter'
metrics_path: /probe
params:
module: [icmp] # Look for a HTTP 200 response.
static_configs:
- targets: ['172.18.40.111','172.18.40.40','172.18.40.41','172.18.40.42','172.18.40.43','172.18.40.44','172.18.40.45','172.18.40.46','172.18.40.47','172.18.40.48','172.18.40.49']
labels:
group: '172.26.42.215'
relabel_configs:
- source_labels: [__address__]
target_label: __param_target
- source_labels: [__param_target]
target_label: instance
- target_label: __address__
replacement: 172.26.42.215:9115 # The blackbox exporter's real hostname:port.
- job_name: 'alertmanager'
http_sd_configs:
- url: http://172.16.62.99:12000/prometheus/getTargetByType?exporterType=ALERTMANAGER
refresh_interval: 5s
- job_name: 'consul-prometheus'
consul_sd_configs:
- server: '172.26.42.215:8500'
services: []
relabel_configs:
- source_labels: [__meta_consul_tags]
regex: .*test.*
action: keep
- regex: __meta_consul_service_metadata_(.+)
action: labelmap
本博客所有文章除特别声明外,均采用 CC BY-NC-SA 4.0 许可协议。转载请注明来自 牛蛙JUN!


