Prometheus学习记录
目标
- Prometheus 是什么;
- 我们为什么要去了解Prometheus ;
- 为什么是Prometheus 而不是其他的监控系统;Prometheus 与 目前 相对比较活跃的其他监控系统有哪些 优势;
- 了解Prometheus 的基本架构,以及Prometheus 是如何运作的;
Prometheus 是什么?
简介
Prometheus受启发于Google的Brogmon监控系统(相似的Kubernetes是从Google的Brog系统演变而来),从2012年开始由前Google工程师在Soundcloud以开源软件的形式进行研发,并且于2015年早期对外发布早期版本。2016年5月继Kubernetes之后成为第二个正式加入CNCF基金会的项目,同年6月正式发布1.0版本。2017年底发布了基于全新存储层的2.0版本,能更好地与容器平台、云平台配合。
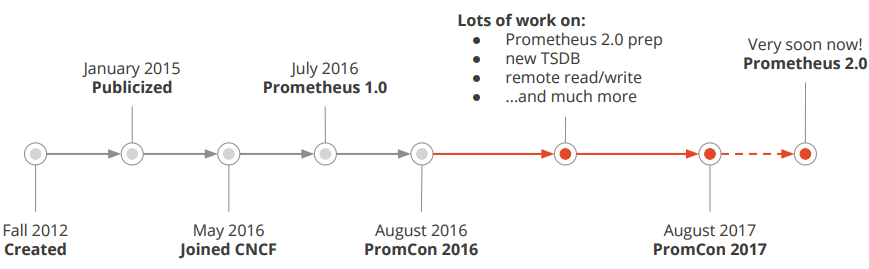
Prometheus简史
Prometheus作为新一代的云原生监控系统,目前已经有超过650+位贡献者参与到Prometheus的研发工作上,并且超过120+项的第三方集成。
目前的社区活跃度:从如下在github上的截图可以看出其活跃度 (截图时间2021.9.2)
监控目标
- 长期趋势分析:通过对监控样本数据的持续收集和统计,对监控指标进行长期趋势分析。例如,通过对磁盘空间增长率的判断,我们可以提前预测在未来什么时间节点上需要对资源进行扩容。(实际就是使用PromQL表达式(内置的函数)对采集的监控数据进行数学分析(统计学) )
- 对照分析:两个版本的系统运行资源使用情况的差异如何?在不同容量情况下系统的并发和负载变化如何?通过监控能够方便的对系统进行跟踪和比较。(同样是基于监控数据,例如:两个相同应用在不同的系统资源下的并发和负载变化对比)
- 告警:当系统出现或者即将出现故障时,监控系统需要迅速反应并通知管理员,从而能够对问题进行快速的处理或者提前预防问题的发生,避免出现对业务的影响。() Prometheus 服务端产生告警,由Alertmanager进行处理
- 故障分析与定位:当问题发生后,需要对问题进行调查和处理。通过对不同监控监控以及历史数据的分析,能够找到并解决根源问题。(分析监控数据)
- 数据可视化:通过可视化仪表盘能够直接获取系统的运行状态、资源使用情况、以及服务运行状态等直观的信息。(Prometheus 自带数据可视化UI , 但是比较简单)
这里还是只是对Prometheus 进行了一个简单的介绍,我们可以简单的将其类比和宇云的 monitor(云监控中心)
为什么要去了解Prometheus
或者说为什么要了解其他的 监控系统,我们的平台已经有了 云监控中心;
个人认为有如下几个原因:
- 了解其他的监控系统,学习它们的优点,对 我们平台的云监控进行优化,例如 监控指标的完善与优化
- 目前我们的云监控中心是基于虚拟机的监控,对容器的监控还没有涉足,需要学习这些优秀产品的经验,为后期和宇云进军k8s做准备
当然针对不同的需求,还需要具体分析
各监控系统的对比
目前市面上相对比较活跃的监控系统:
- Prometheus
- Zabbix
- Nagios
Prometheus 与 Zabbix 对比
架构对比
prometheus:
zabbix:
综合对比

总结
我们要对容器进行兼容,则需要学习Prometheus。
Prometheus 与 Nagios 对比
架构对比
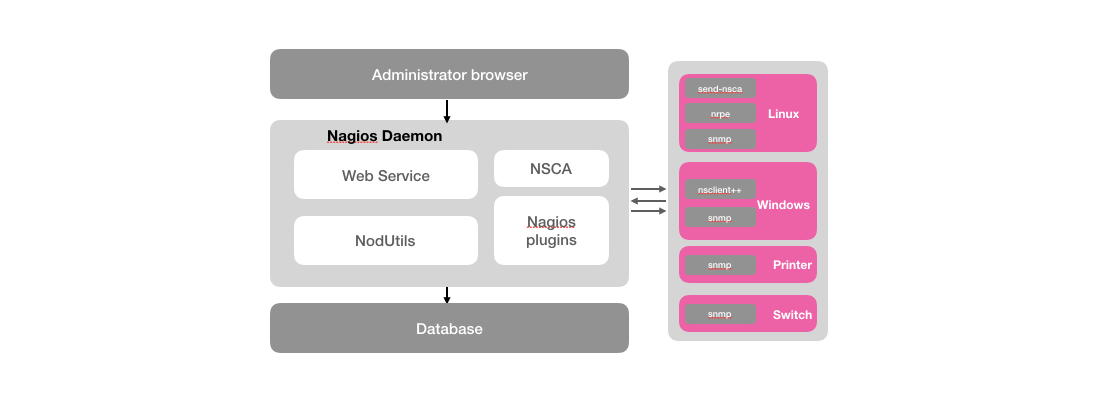
Nagios监控系统
Nagios的主要功能是监控服务和主机。Nagios软件需要安装在一台独立的服务器上运行,该服务器称为监控中心。每一台被监控的硬件主机或者服务都需要运行一个与监控中心服务器进行通信的Nagios软件后台程序,可以理解为Agent或者插件;
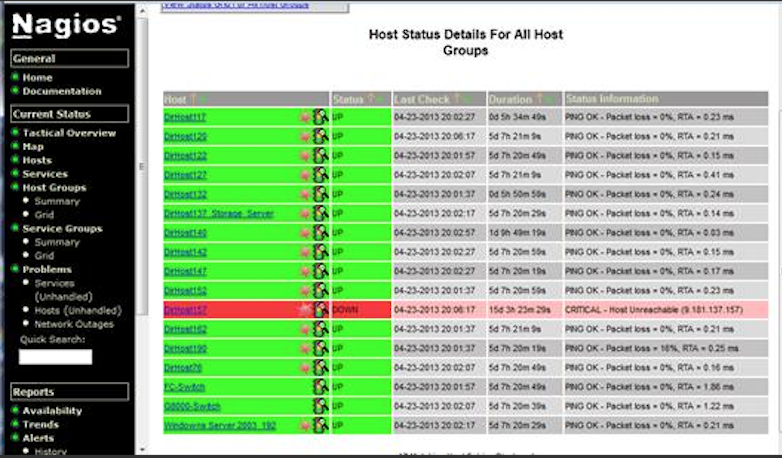
Nagios主机监控页面
首先对于Nagios而言,大部分的监控能力都是围绕系统的一些边缘性的问题,主要针对系统服务和资源的状态以及应用程序的可用性。 例如:Nagios通过check_disk插件可以用于检查磁盘空间,check_load用于检查CPU负载等。这些插件会返回4种Nagios可识别的状态,0(OK)表示正常,1(WARNING)表示警告,2(CRITTCAL)表示错误,3(UNKNOWN)表示未知错误,并通过Web UI显示出来。
对于Nagios这类系统而言,其核心是采用了测试和告警(check&alert)的监控系统模型。 对于基于这类模型的监控系统而言往往存在以下问题:
- 与业务脱离的监控:监控系统获取到的监控指标与业务本身也是一种分离的关系。好比客户可能关注的是服务的可用性、服务的SLA等级,而监控系统却只能根据系统负载去产生告警;
- 运维管理难度大:Nagios这一类监控系统本身运维管理难度就比较大,需要有专业的人员进行安装,配置和管理,而且过程并不简单;
- 可扩展性低: 监控系统自身难以扩展,以适应监控规模的变化;
- 问题定位难度大:当问题产生之后(比如主机负载异常增加)对于用户而言,他们看到的依然是一个黑盒,他们无法了解主机上服务真正的运行情况,因此当故障发生后,这些告警信息并不能有效的支持用户对于故障根源问题的分析和定位。
nagios现在用的相对比较少了,数据展示太不友好,还需要插件实现,ui也不够美观;自动化批量监控也掉链子。
Prometheus 的优势
Prometheus是一个开源的完整监控解决方案,其对传统监控系统的测试和告警模型进行了彻底的颠覆,形成了基于中央化的规则计算、统一分析和告警的新模型。 相比于传统监控系统Prometheus具有以下优点:
- 易于管理 Prometheus基于Pull模型的架构方式,可以在任何地方(本地电脑,开发环境,测试环境)搭建我们的监控系统。对于一些复杂的情况,还可以使用Prometheus服务发现(Service Discovery)的能力动态管理监控目标。
- 监控服务的内部运行状态 Pometheus鼓励用户监控服务的内部状态,基于Prometheus丰富的Client库,用户可以轻松的在应用程序中添加对Prometheus的支持,从而让用户可以获取服务和应用内部真正的运行状态。

- 强大的数据模型 所有采集的监控数据均以指标(metric)的形式保存在内置的时间序列数据库当中(TSDB)。所有的样本除了基本的指标名称以外,还包含一组用于描述该样本特征的标签。
1
2
http_request_status{code='200',content_path='/api/path', environment='produment'} => [value1@timestamp1,value2@timestamp2...]
http_request_status{code='200',content_path='/api/path2', environment='produment'} => [value1@timestamp1,value2@timestamp2...] - 强大的查询语言PromQL Prometheus内置了一个强大的数据查询语言PromQL。 通过PromQL可以实现对监控数据的查询、聚合。同时PromQL也被应用于数据可视化(如Grafana)以及告警当中。
- 高效 对于监控系统而言,大量的监控任务必然导致有大量的数据产生。而Prometheus可以高效地处理这些数据,对于单一Prometheus Server实例而言它可以处理:
- 数以百万的监控指标
每秒处理数十万的数据点
- 可扩展 Prometheus是如此简单,因此你可以在每个数据中心、每个团队运行独立的Prometheus Sevrer。Prometheus对于联邦集群的支持,可以让多个Prometheus实例产生一个逻辑集群,当单实例Prometheus Server处理的任务量过大时,通过使用功能分区(sharding)+联邦集群(federation)可以对其进行扩展。
- 易于集成 使用Prometheus可以快速搭建监控服务,并且可以非常方便地在应用程序中进行集成。目前支持: Java, JMX, Python, Go,Ruby, .Net, Node.js等等语言的客户端SDK,基于这些SDK可以快速让应用程序纳入到Prometheus的监控当中,或者开发自己的监控数据收集程序。同时这些客户端收集的监控数据,不仅仅支持Prometheus,还能支持Graphite这些其他的监控工具。 同时Prometheus还支持与其他的监控系统进行集成:Graphite, Statsd, Collected, Scollector, muini, Nagios等。 Prometheus社区还提供了大量第三方实现的监控数据采集支持:JMX, CloudWatch, EC2, MySQL, PostgresSQL, Haskell, Bash, SNMP, Consul, Haproxy, Mesos, Bind, CouchDB, Django, Memcached, RabbitMQ, Redis, RethinkDB, Rsyslog等等。
- 可视化 Prometheus Server中自带了一个Prometheus UI,通过这个UI可以方便地直接对数据进行查询,并且支持直接以图形化的形式展示数据。同时Prometheus还提供了一个独立的基于Ruby On Rails的Dashboard解决方案Promdash。最新的Grafana可视化工具也已经提供了完整的Prometheus支持,基于Grafana可以创建更加精美的监控图标。基于Prometheus提供的API还可以实现自己的监控可视化UI。
- 开放性 通常来说当我们需要监控一个应用程序时,一般需要该应用程序提供对相应监控系统协议的支持。因此应用程序会与所选择的监控系统进行绑定。为了减少这种绑定所带来的限制。对于决策者而言要么你就直接在应用中集成该监控系统的支持,要么就在外部创建单独的服务来适配不同的监控系统。 而对于Prometheus来说,使用Prometheus的client library的输出格式不止支持Prometheus的格式化数据,也可以输出支持其它监控系统的格式化数据,比如Graphite。 因此你甚至可以在不使用Prometheus的情况下,采用Prometheus的client library来让你的应用程序支持监控数据采集。
可以说 Prometheus 是一个监控告警系统,也是一个时序数据库
了解了 Prometheus 是什么,也分析了 为什么要了解 Prometheus , 现在来 看看 Prometheus 是怎么做的
Prometheus 解析
架构
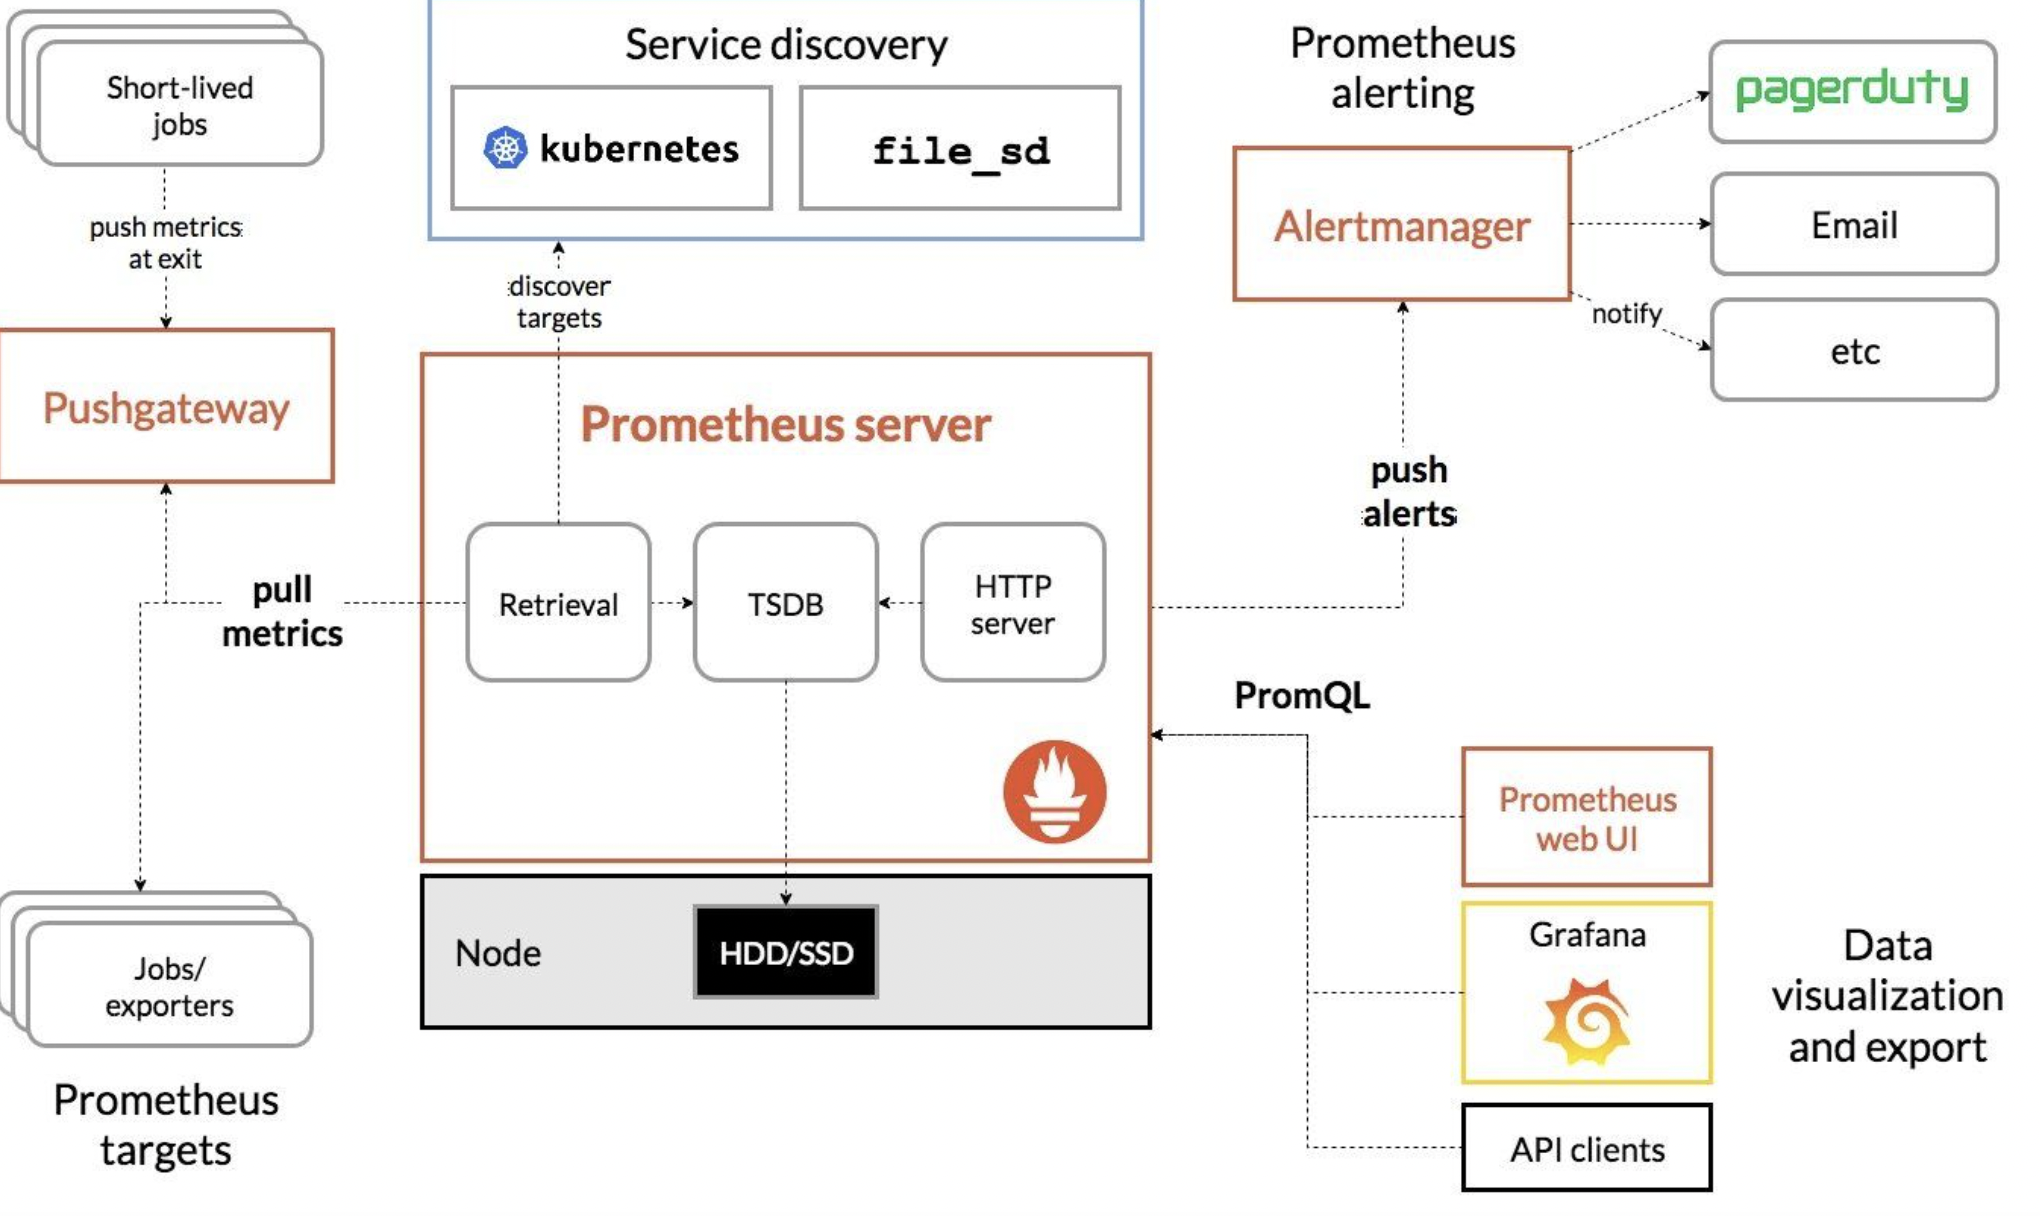
三大套件
- Prometheus Server 主要负责数据采集和存储,提供PromQL查询语言的支持。
- Alertmanager 警告管理器,用来进行报警,告警信息推送。
- Push Gateway 支持临时性Job主动推送指标的中间网关。

Prometheus Server
Prometheus 是如何采集监控数据
监控数据的获取有如下两种方式:
- Pull 的方式 通过定时抓取 目标上的Metrics数据,每个抓取目标都需要暴露一个HTTP服务接口用于Prometheus定时抓取,这种调用被监控对象获取监控数据的方式被称为Pull

- Push的方式 Prometheus提供对PushGateway的支持,这些系统主动推送metrics到PushGateway,而Prometheus只是定时去Gateway上抓取数据。

什么情况下会用到 Push的方式呢?
- Prometheus 采用定时 Pull 模式,可能由于子网络或者防火墙的原因,不能直接拉取各个 Target 的指标数据,此时可以采用各个 Target 往 PushGateway 上 Push 数据,然后 Prometheus 去 PushGateway 上定时 pull。
- 其次在监控各个业务数据时,需要将各个不同的业务数据进行统一汇总,此时也可以采用 PushGateway 来统一收集,然后 Prometheus 来统一拉取。
采集数据的主要流程如下:
- Prometheus server 定期从静态配置的主机或服务发现的 targets 拉取数据(zookeeper,consul,DNS SRV Lookup等方式)
- 当新拉取的数据大于配置内存缓存区的时候(或者 超过了设定的时间窗口的时间),Prometheus会将数据持久化到磁盘,也可以远程持久化到云端。
- Prometheus通过PromQL、API、Console和其他可视化组件如Grafana、Promdash展示数据。
- Prometheus 可以配置rules,然后定时查询数据,当条件触发的时候,会将告警推送到配置的Alertmanager。
- Alertmanager收到告警的时候,会根据配置,聚合,去重,降噪,最后发出警告, Alertmanager是独立于Prometheus的一个组件,可以支持Prometheus的查询语句,提供十分灵活的报警方式。
指标数据的样式如下:
http://172.26.65.49:9100/metrics
1 | # HELP node_cpu_guest_seconds_total Seconds the CPUs spent in guests (VMs) for each mode. |
Metric类型(指标类型)
Prometheus定义了4种不同的指标类型(metric type):Counter(计数器)、Gauge(仪表盘)、Histogram(直方图)、Summary(摘要)
Counter:只增不减的计数器
Counter类型的指标其工作方式和计数器一样,只增不减(除非系统发生重置)。
常见的监控指标,如http_requests_total,node_cpu都是Counter类型的监控指标。 一般在定义Counter类型指标的名称时推荐使用_total作为后缀。
Gauge:可增可减的仪表盘
Gauge类型的指标侧重于反应系统的当前状态。
常见指标如:node_memory_MemFree(主机当前空闲的内容大小)、node_memory_MemAvailable(可用内存大小)都是Gauge类型的监控指标。
使用Histogram和Summary分析数据分布情况
除了Counter和Gauge类型的监控指标以外,Prometheus还定义了Histogram和Summary的指标类型。Histogram和Summary主用用于统计和分析样本的分布情况
在大多数情况下人们都倾向于使用某些量化指标的平均值,例如CPU的平均使用率、页面的平均响应时间。这种方式的问题很明显,以系统API调用的平均响应时间为例:如果大多数API请求都维持在100ms的响应时间范围内,而个别请求的响应时间需要5s,那么就会导致某些WEB页面的响应时间落到中位数的情况,而这种现象被称为长尾问题。
为了区分是平均的慢还是长尾的慢,最简单的方式就是按照请求延迟的范围进行分组。例如,统计延迟在010ms之间的请求数有多少而1020ms之间的请求数又有多少。通过这种方式可以快速分析系统慢的原因。Histogram和Summary都是为了能够解决这样问题的存在,通过Histogram和Summary类型的监控指标,我们可以快速了解监控样本的分布情况。
例如: wal_fsync处理的处理时间 (Summary类型)
1 | # HELP prometheus_tsdb_wal_fsync_duration_seconds Duration of WAL fsync. |
Exporter 详解
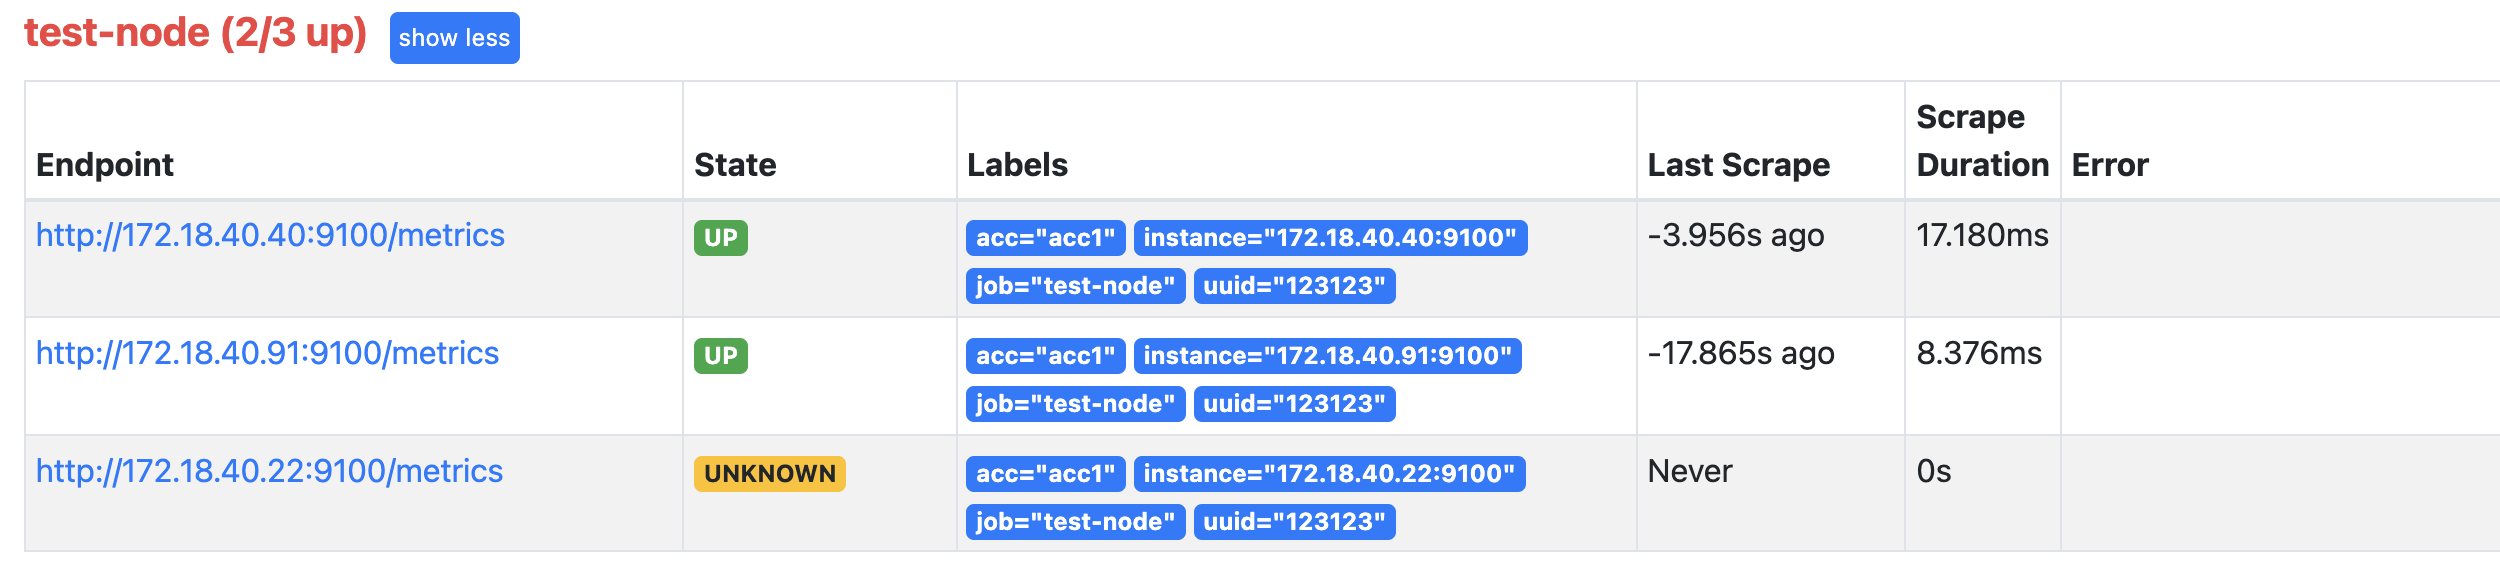
广义上讲所有可以向Prometheus提供监控样本数据的程序都可以被称为一个Exporter,而Exporter的一个实例称为target。
Exporter 是 安装在被监控的目标(主机或服务)上,用于采集目标上相应的监控数据,同时会暴露出Http的接口,普罗米修斯通过HTTP协议使用Pull的方式周期性拉取相应的数据。

Exporter的来源
从Exporter的来源上来讲,主要分为两类:
- 社区提供的 Prometheus社区提供了丰富的Exporter实现,涵盖了从基础设施,中间件以及网络等各个方面的监控功能。这些Exporter可以实现大部分通用的监控需求。下表列举一些社区中常用的Exporter:(Exporters and integrations | Prometheus官网) Untitled
- 用户自定义的 除了直接使用社区提供的Exporter程序以外,用户还可以基于Prometheus提供的Client Library创建自己的Exporter程序,目前Promthues社区官方提供了对以下编程语言的支持:Go、Java/Scala、Python、Ruby。同时还有第三方实现的如:Bash、C++、Common Lisp、Erlang,、Haskeel、Lua、Node.js、PHP、Rust等。 【使用Client Java构建Exporter程序】https://www.bookstack.cn/read/prometheus-book/exporter-client_library_java.md
Prometheus监控数据的存储
数据存储的方式分为如下两种:
- 一种是本地存储。通过Prometheus自带的时序数据库将数据保存到本地磁盘,为了性能考虑,建议使用SSD。但本地存储的容量毕竟有限,建议不要保存超过一个月的数据。
- 另一种是远程存储,适用于存储大量监控数据。通过中间层的适配器的转化,目前Prometheus支持OpenTSDB、InfluxDB、Elasticsearch等后端存储,通过适配器实现Prometheus存储的remote write和remote read接口,便可以接入Prometheus作为远端存储使用。
本地存储
特点:
① 自身运维和管理的复杂度低
Prometheus 2.x 采用自定义的存储格式将样本数据保存在本地磁盘当中。如下所示,按照两个小时为一个时间窗口,将两小时内产生的数据存储在一个块(Block)中,每一个块中包含该时间窗口内的所有样本数据(chunks),元数据文件(meta.json)以及索引文件(index)。
1 | t0 t1 t2 now |
当前时间窗口内正在收集的样本数据,Prometheus则会直接将数据保存在内存当中。为了确保此期间如果Prometheus发生崩溃或者重启时能够恢复数据,Prometheus启动时会从写入日志(WAL)进行重播,从而恢复数据。此期间如果通过API删除时间序列,删除记录也会保存在单独的逻辑文件当中(tombstone)。
在文件系统中这些块保存在单独的目录当中,Prometheus保存块数据的目录结构如下所示:
1 | ./data |
本地存储配置:
对Prometheus Server的本地磁盘空间做容量规划时,可以通过以下公式计算:
1 | needed_disk_space = retention_time_seconds * ingested_samples_per_second * bytes_per_sample |
其中:保留时间(retention_time_seconds)、每秒获取样本数(ingested_samples_per_second)、样本大小(bytes_per_sample)
减少本地磁盘的容量需求,可以通过 减少 每秒获取样本数 这个数值 的方式 ;有两种手段,一是减少时间序列的数量,二是增加采集样本的时间间隔。考虑到Prometheus会对时间序列进行压缩效率,减少时间序列的数量效果更明显。
远程存储
特点:
① 可以持久化大量历史数据
② 灵活扩展
③ 方便迁移
为了保持Prometheus的简单性,Prometheus并没有尝试在自身中解决以上问题,而是通过定义两个标准接口(remote_write/remote_read),让用户可以基于这两个接口对接将数据保存到任意第三方的存储服务中,这种方式在Promthues中称为Remote Storage。
【Remote Write】(远程写)
用户可以在Prometheus配置文件中指定Remote Write(远程写)的URL地址,一旦设置了该配置项,Prometheus将采集到的样本数据通过HTTP的形式发送给适配器(Adaptor)。而用户则可以在适配器中对接外部任意的服务。外部服务可以是真正的存储系统,公有云的存储服务,也可以是消息队列等任意形式。

Remote Write
【Remote Read】(远程读)
Promthues的Remote Read(远程读)也通过了一个适配器实现。在远程读的流程当中,当用户发起查询请求后,Promthues将向remote_read中配置的URL发起查询请求(matchers,ranges),Adaptor根据请求条件从第三方存储服务中获取响应的数据。同时将数据转换为Promthues的原始样本数据返回给Prometheus Server。
当获取到样本数据后,Promthues在本地使用PromQL对样本数据进行二次处理
1 | 注意:启用远程读设置后,只在数据查询时有效,对于规则文件的处理,以及Metadata API的处理都只基于Prometheus本地存储完成。 |

Remote Read
适配器:需要部署到数据库所在的服务器,暴露HTTP服务,并且将数据写入数据库中
远程读写配置:
Prometheus配置文件中添加remote_write和remote_read配置,其中url用于指定远程读/写的HTTP服务地址。如果该URL启动了认证则可以通过basic_auth进行安全认证配置。对于https的支持需要设定tls_concig。proxy_url主要用于Prometheus无法直接访问适配器服务的情况下。
1 | # The URL of the endpoint to send samples to. |
自定义Remote Storage Adaptor(自定义适配器)
详情见:https://www.bookstack.cn/read/prometheus-book/ha-prometheus-remote-storage.md
目前Prometheus社区也提供了部分对于第三方数据库的Remote Storage支持:
自定义Remote Storage Adaptor(自定义适配器)以及 使用Influxdb作为Remote Storage的案例
详情见:https://www.bookstack.cn/read/prometheus-book/ha-prometheus-remote-storage.md
Prometheus 高可用部署方案
Prometheus的本地存储给Prometheus带来了简单高效的使用体验,可以让Promthues在单节点的情况下满足大部分用户的监控需求。但是本地存储也同时限制了Prometheus的可扩展性,带来了数据持久化等一系列的问题。通过Prometheus的Remote Storage特性可以解决这一系列问题,包括Promthues的动态扩展,以及历史数据的存储。
而除了数据持久化问题以外,影响Promthues性能表现的另外一个重要因素就是数据采集任务量,以及单台Promthues能够处理的时间序列数。因此当监控规模大到Promthues单台无法有效处理的情况下,可以选择利用Promthues的联邦集群的特性,将Promthues的监控任务划分到不同的实例当中。
基本HA:服务可用性
由于Promthues的Pull机制的设计,为了确保Promthues服务的可用性,用户只需要部署多套Prometheus Server实例,并且采集相同的Exporter目标即可。

基本的HA模式只能确保Promthues服务的可用性问题,但是不解决Prometheus Server之间的数据一致性问题以及持久化问题(数据丢失后无法恢复),也无法进行动态的扩展。因此这种部署方式适合监控规模不大,Promthues Server也不会频繁发生迁移的情况,并且只需要保存短周期监控数据的场景。
基本HA + 远程存储
在基本HA模式的基础上通过添加Remote Storage存储支持,将监控数据保存在第三方存储服务上。

在解决了Promthues服务可用性的基础上,同时确保了数据的持久化,当Promthues Server发生宕机或者数据丢失的情况下,可以快速的恢复。 同时Promthues Server可能很好的进行迁移。因此,该方案适用于用户监控规模不大,但是希望能够将监控数据持久化,同时能够确保Promthues Server的可迁移性的场景。
基本HA + 远程存储 + 联邦集群
当单台Promthues Server无法处理大量的采集任务时,用户可以考虑基于Prometheus联邦集群的方式将监控采集任务划分到不同的Promthues实例当中即在任务级别功能分区。
这种部署方式一般适用于两种场景:
场景一:单数据中心 + 大量的采集任务
这种场景下Promthues的性能瓶颈主要在于大量的采集任务,因此用户需要利用Prometheus联邦集群的特性,将不同类型的采集任务划分到不同的Promthues子服务中,从而实现功能分区。例如一个Promthues Server负责采集基础设施相关的监控指标,另外一个Prometheus Server负责采集应用监控指标。再有上层Prometheus Server实现对数据的汇聚。
场景二:多数据中心
这种模式也适合与多数据中心的情况,当Promthues Server无法直接与数据中心中的Exporter进行通讯时,在每一个数据中部署一个单独的Promthues Server负责当前数据中心的采集任务是一个不错的方式。这样可以避免用户进行大量的网络配置,只需要确保主Promthues Server实例能够与当前数据中心的Prometheus Server通讯即可。 中心Promthues Server负责实现对多数据中心数据的聚合。
告警处理Alertmanager
如下所示,通过在Prometheus中定义AlertRule(告警规则),Prometheus会周期性的对告警规则进行计算,如果满足告警触发条件就会向Alertmanager发送告警信息。
自定义Prometheus告警规则
定义告警规则:
1 | groups: |
在告警规则文件中,我们可以将一组相关的规则设置定义在一个group下。在每一个group中我们可以定义多个告警规则(rule)。一条告警规则主要由以下几部分组成:
- alert:告警规则的名称。
- expr:基于PromQL表达式告警触发条件,用于计算是否有时间序列满足该条件。
- for:评估等待时间,可选参数。用于表示只有当触发条件持续一段时间后才发送告警。在等待期间新产生告警的状态为pending。
- labels:自定义标签,允许用户指定要附加到告警上的一组附加标签。
- annotations:用于指定一组附加信息,比如用于描述告警详细信息的文字等,annotations的内容在告警产生时会一同作为参数发送到Alertmanager。
监控数据的可视化
Prometheus自带的数据可视化界面
http://172.26.65.49:9090/graph
例子:指标 prometheus_http_requests_total
使用Grafana展示数据
http://172.26.65.49:3000/?orgId=1
网图:
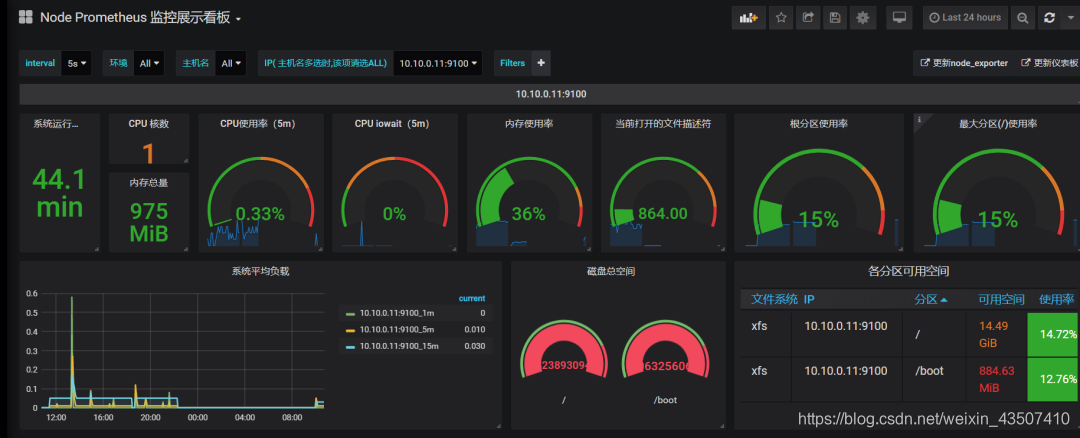
在这里插入图片描述
案例
监控Mysql
前提条件:
- prometheus和grafana环境已搭建
- docker环境已搭建
- mysqld-exporter 所部署的机器上需要存在 mysql实例
操作步骤如下:
- 下载 prom/mysqld-exporter
1
docker pull prom/mysqld-exporter
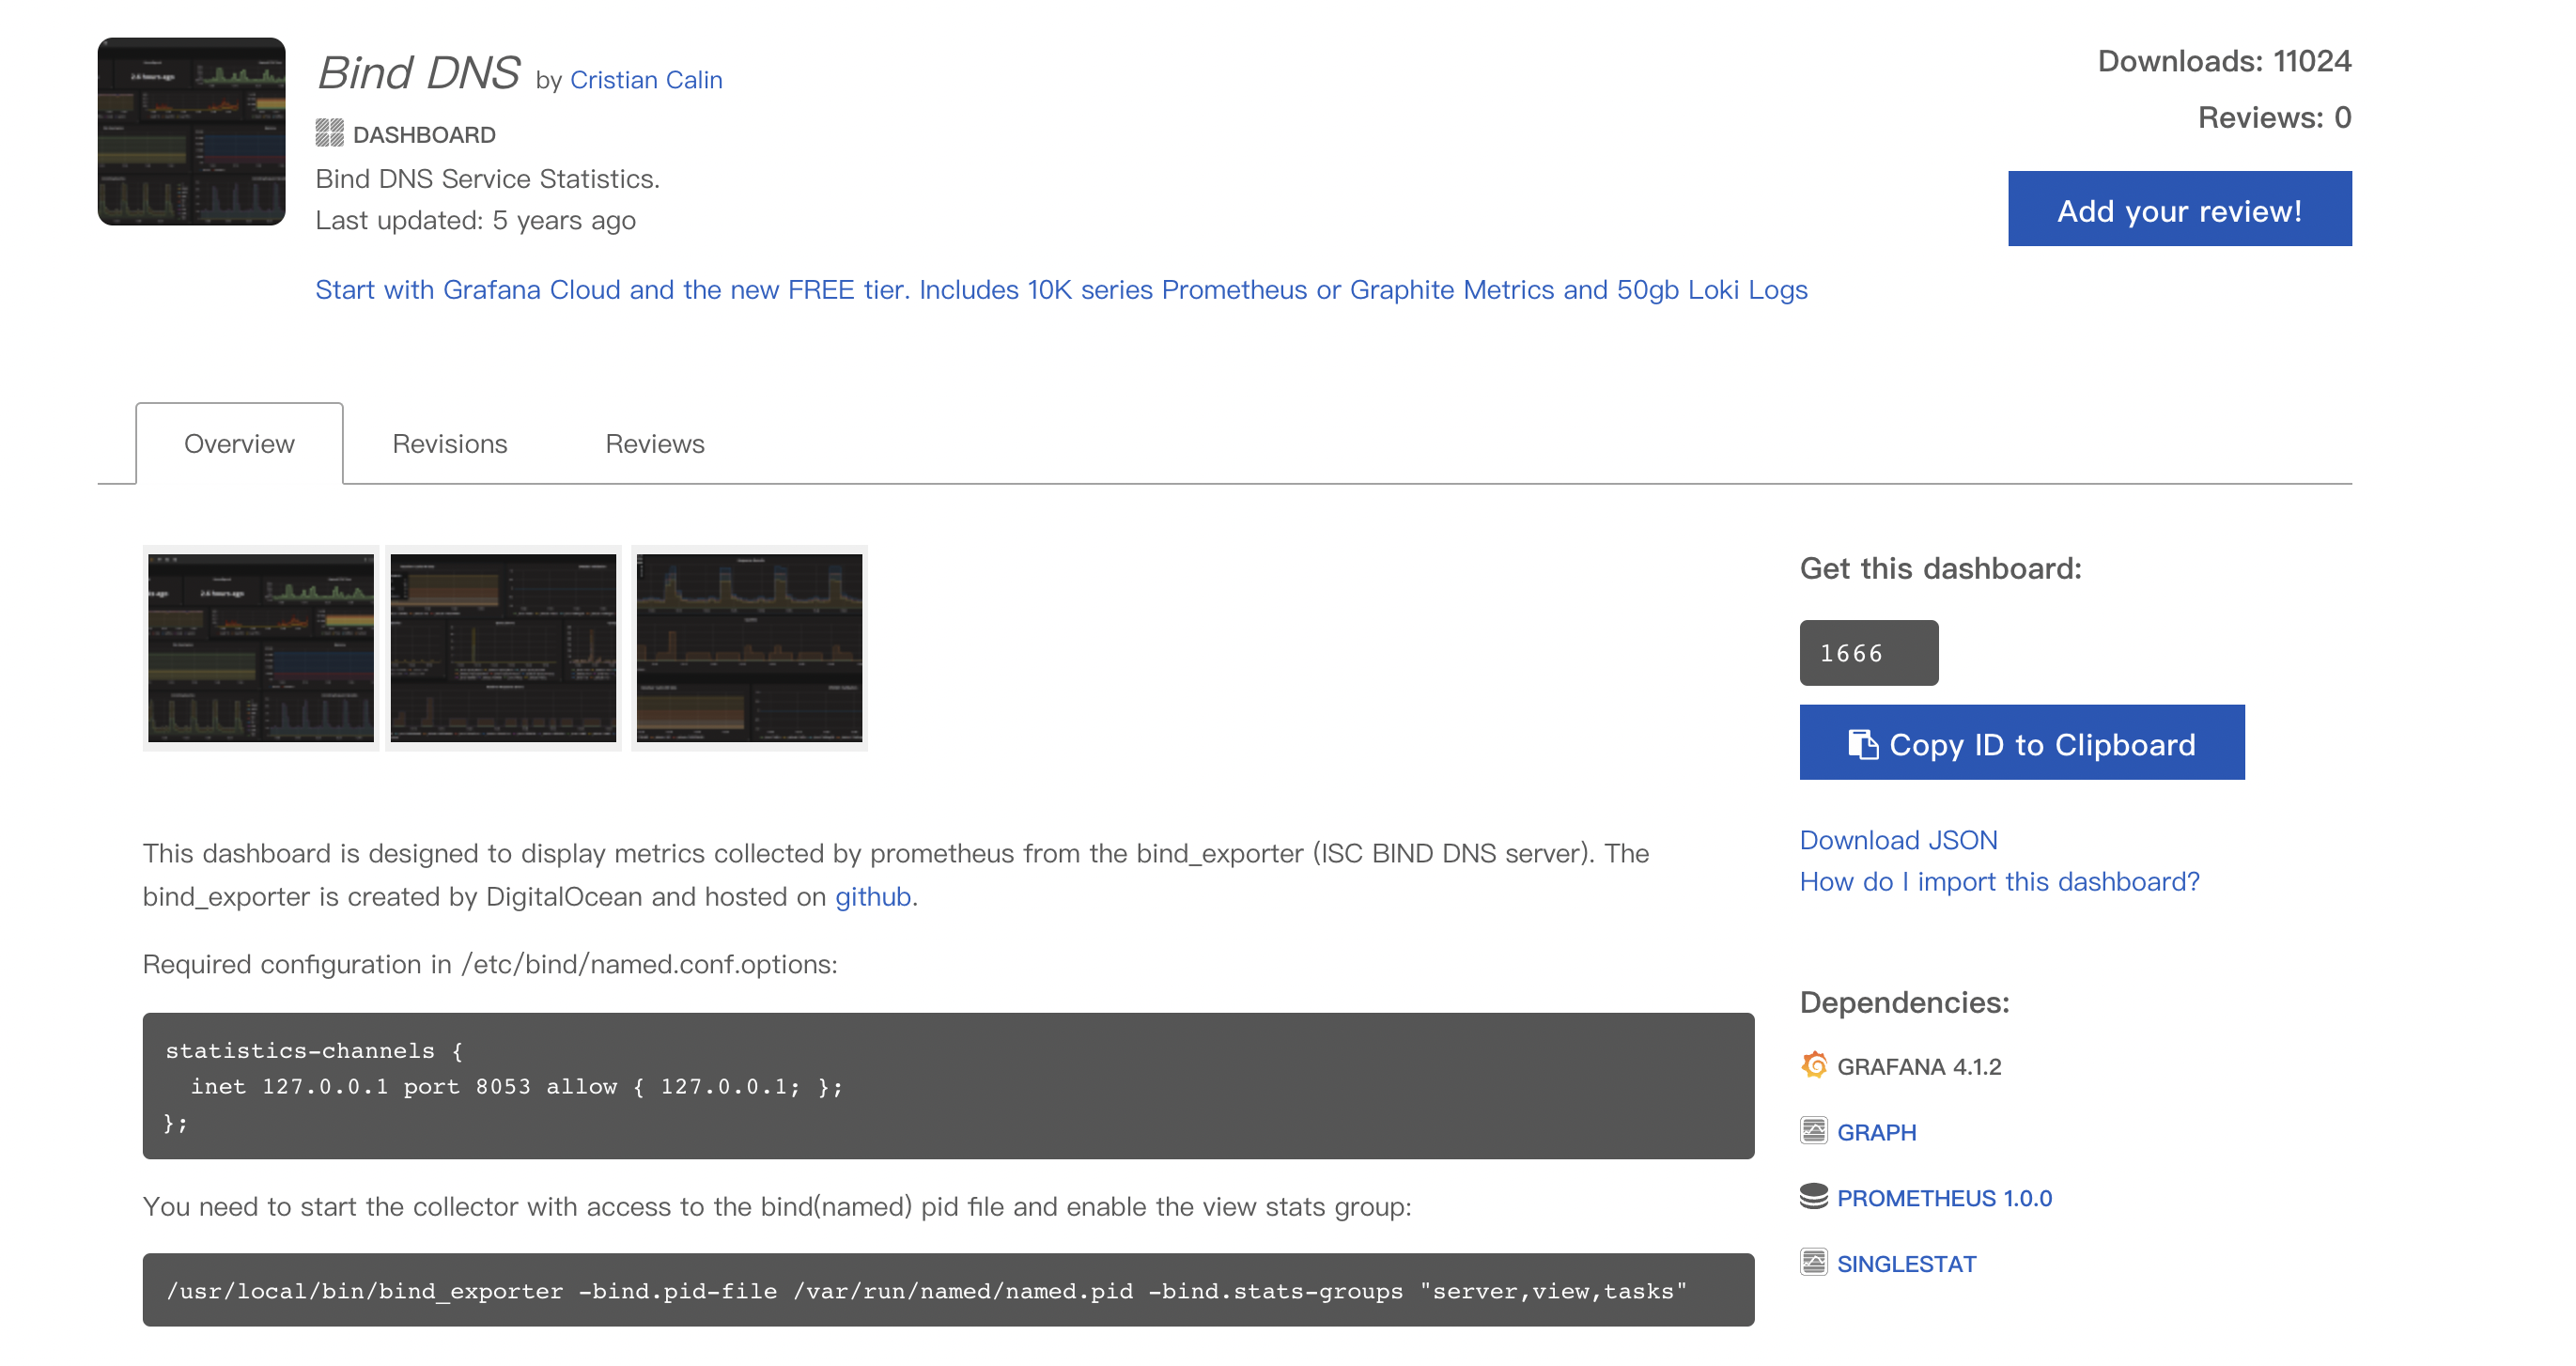
- 在grafana上下载mysql监控数据展示模板 (ID:11323)
1
https://grafana.com/grafana/dashboards/11323
- 运行mysqld-exporter
1
docker run -d --name mysql_exporter --restart always -e DATA_SOURCE_NAME='root:root$123@(172.26.65.49:3306)/' --network host prom/mysqld-exporter
- 在prometheus的配置中添加 mysql_exporter 的job
1
2
3
4
5
6
- job_name: 'MySQL'
static_configs:
- targets: ['172.26.65.49:9104']
labels:
instance: 172.26.65.49:3306
metrics_path: '/metrics'
- 重启prometheus
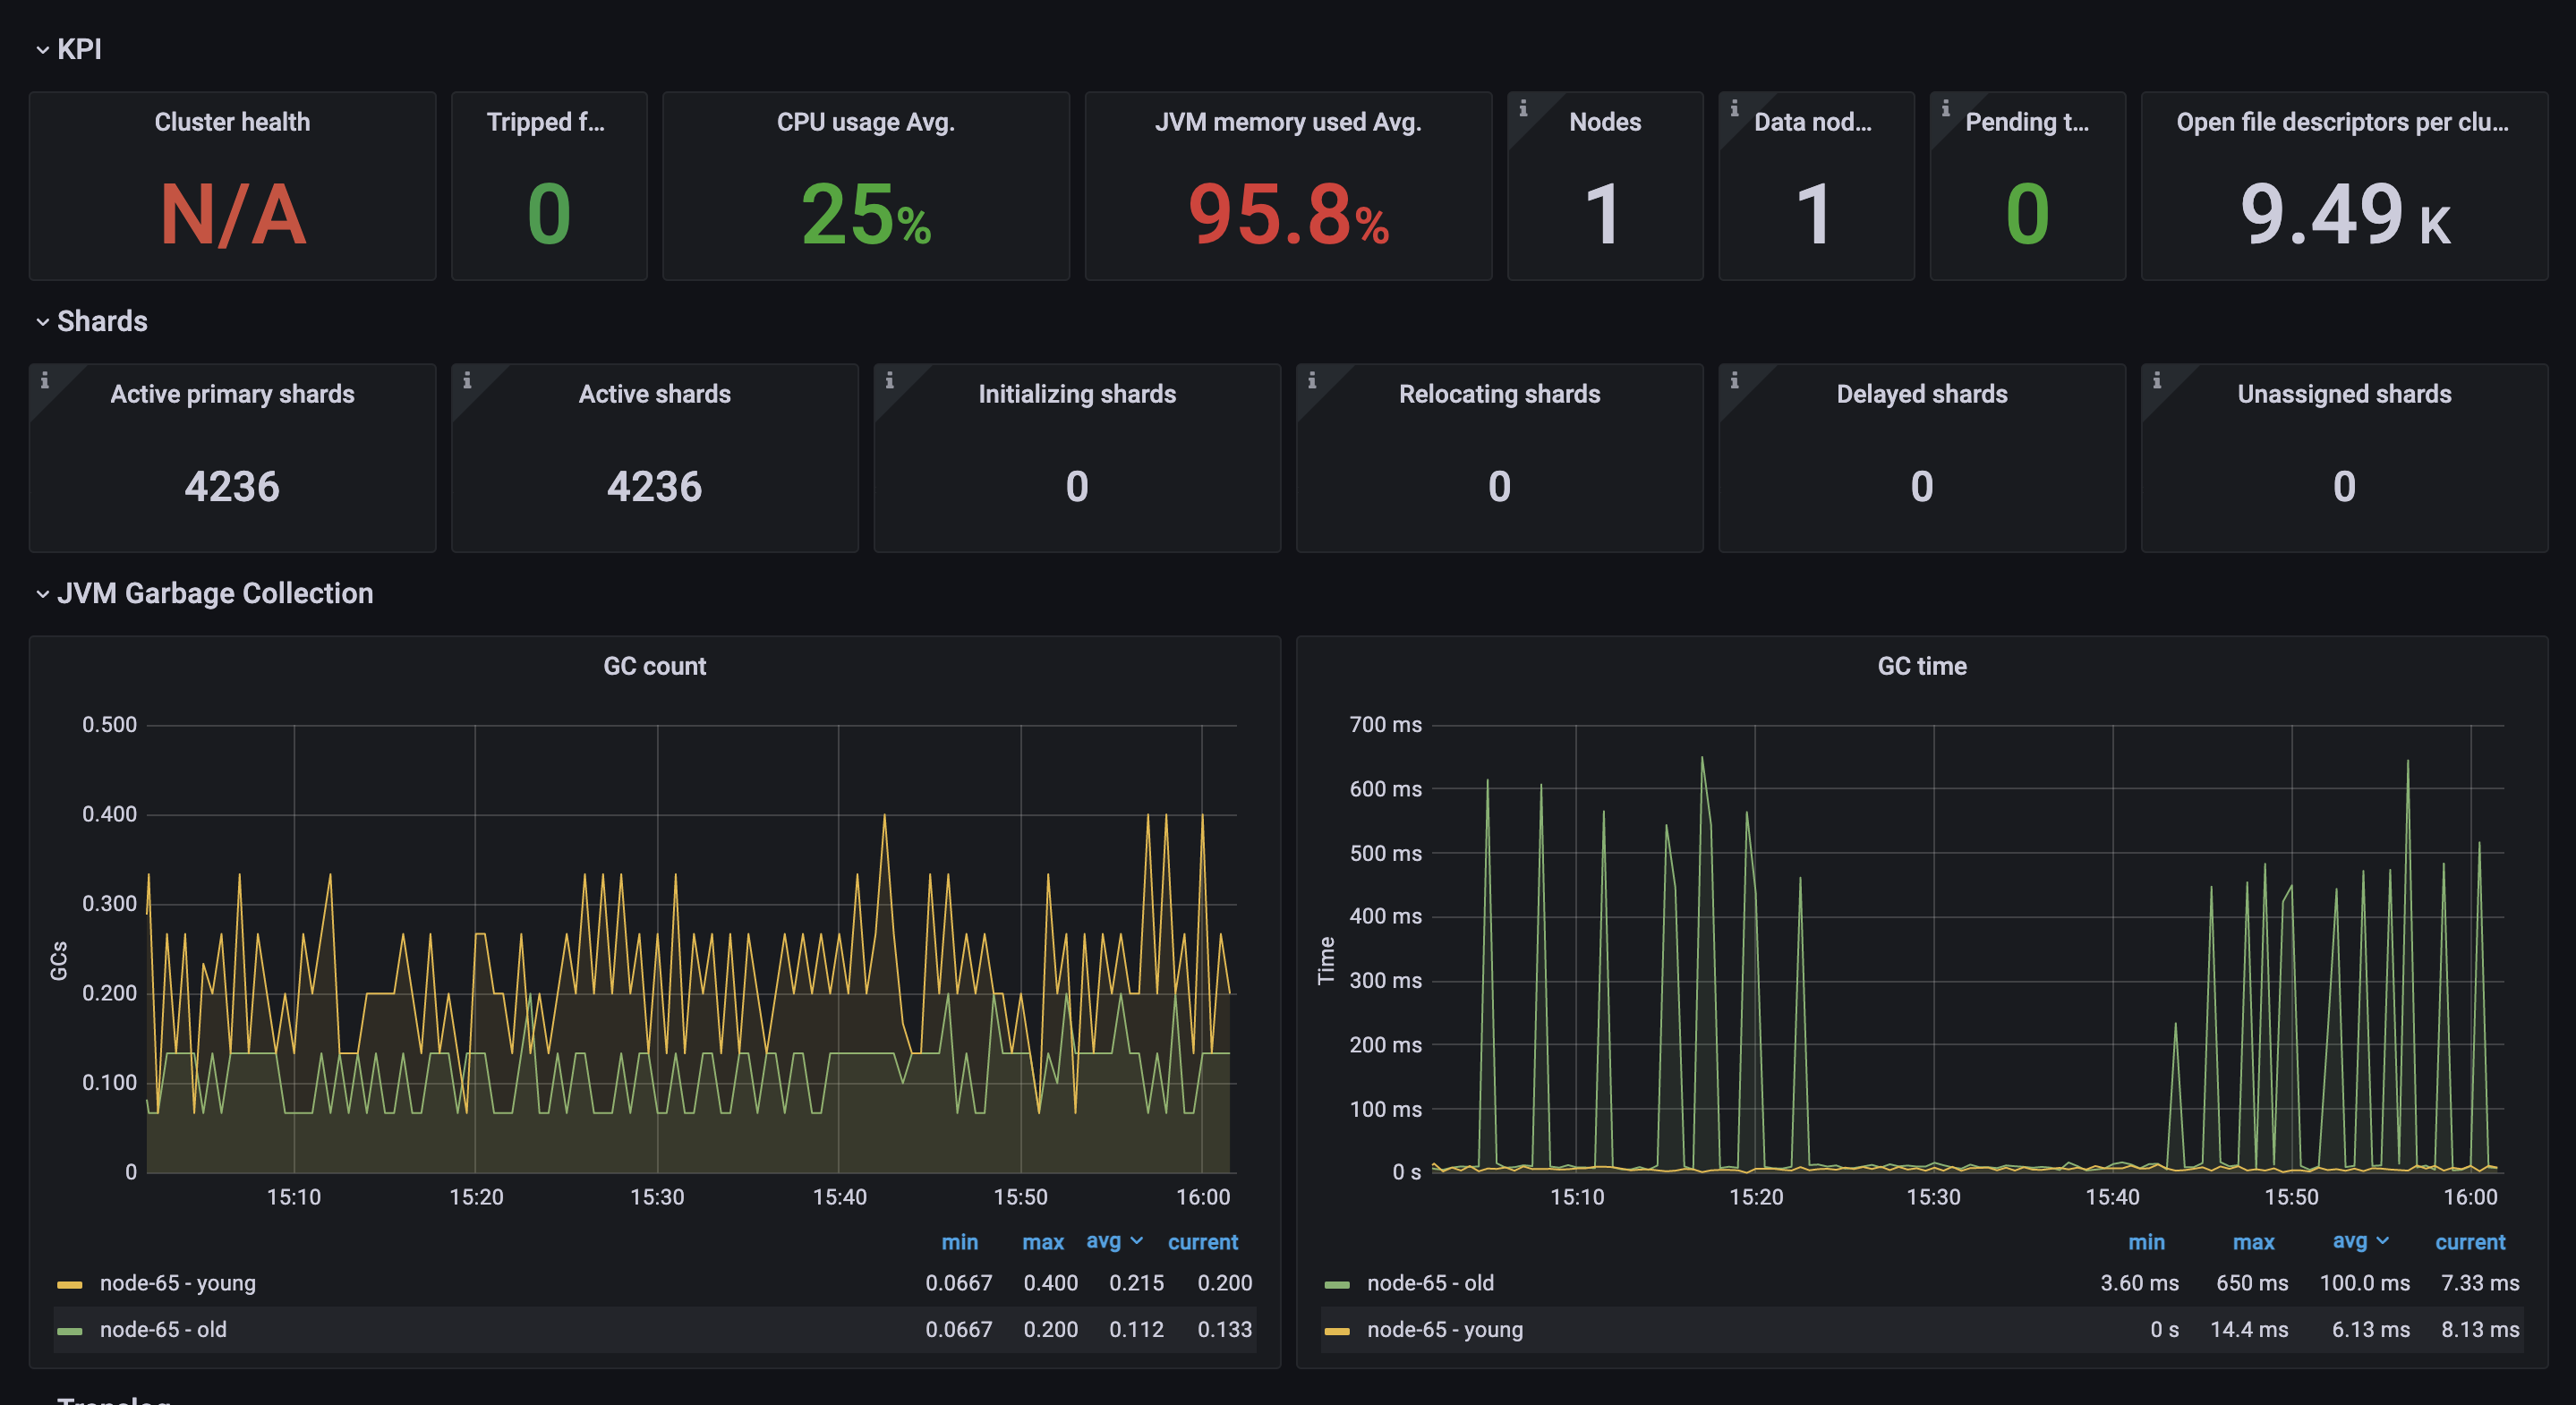
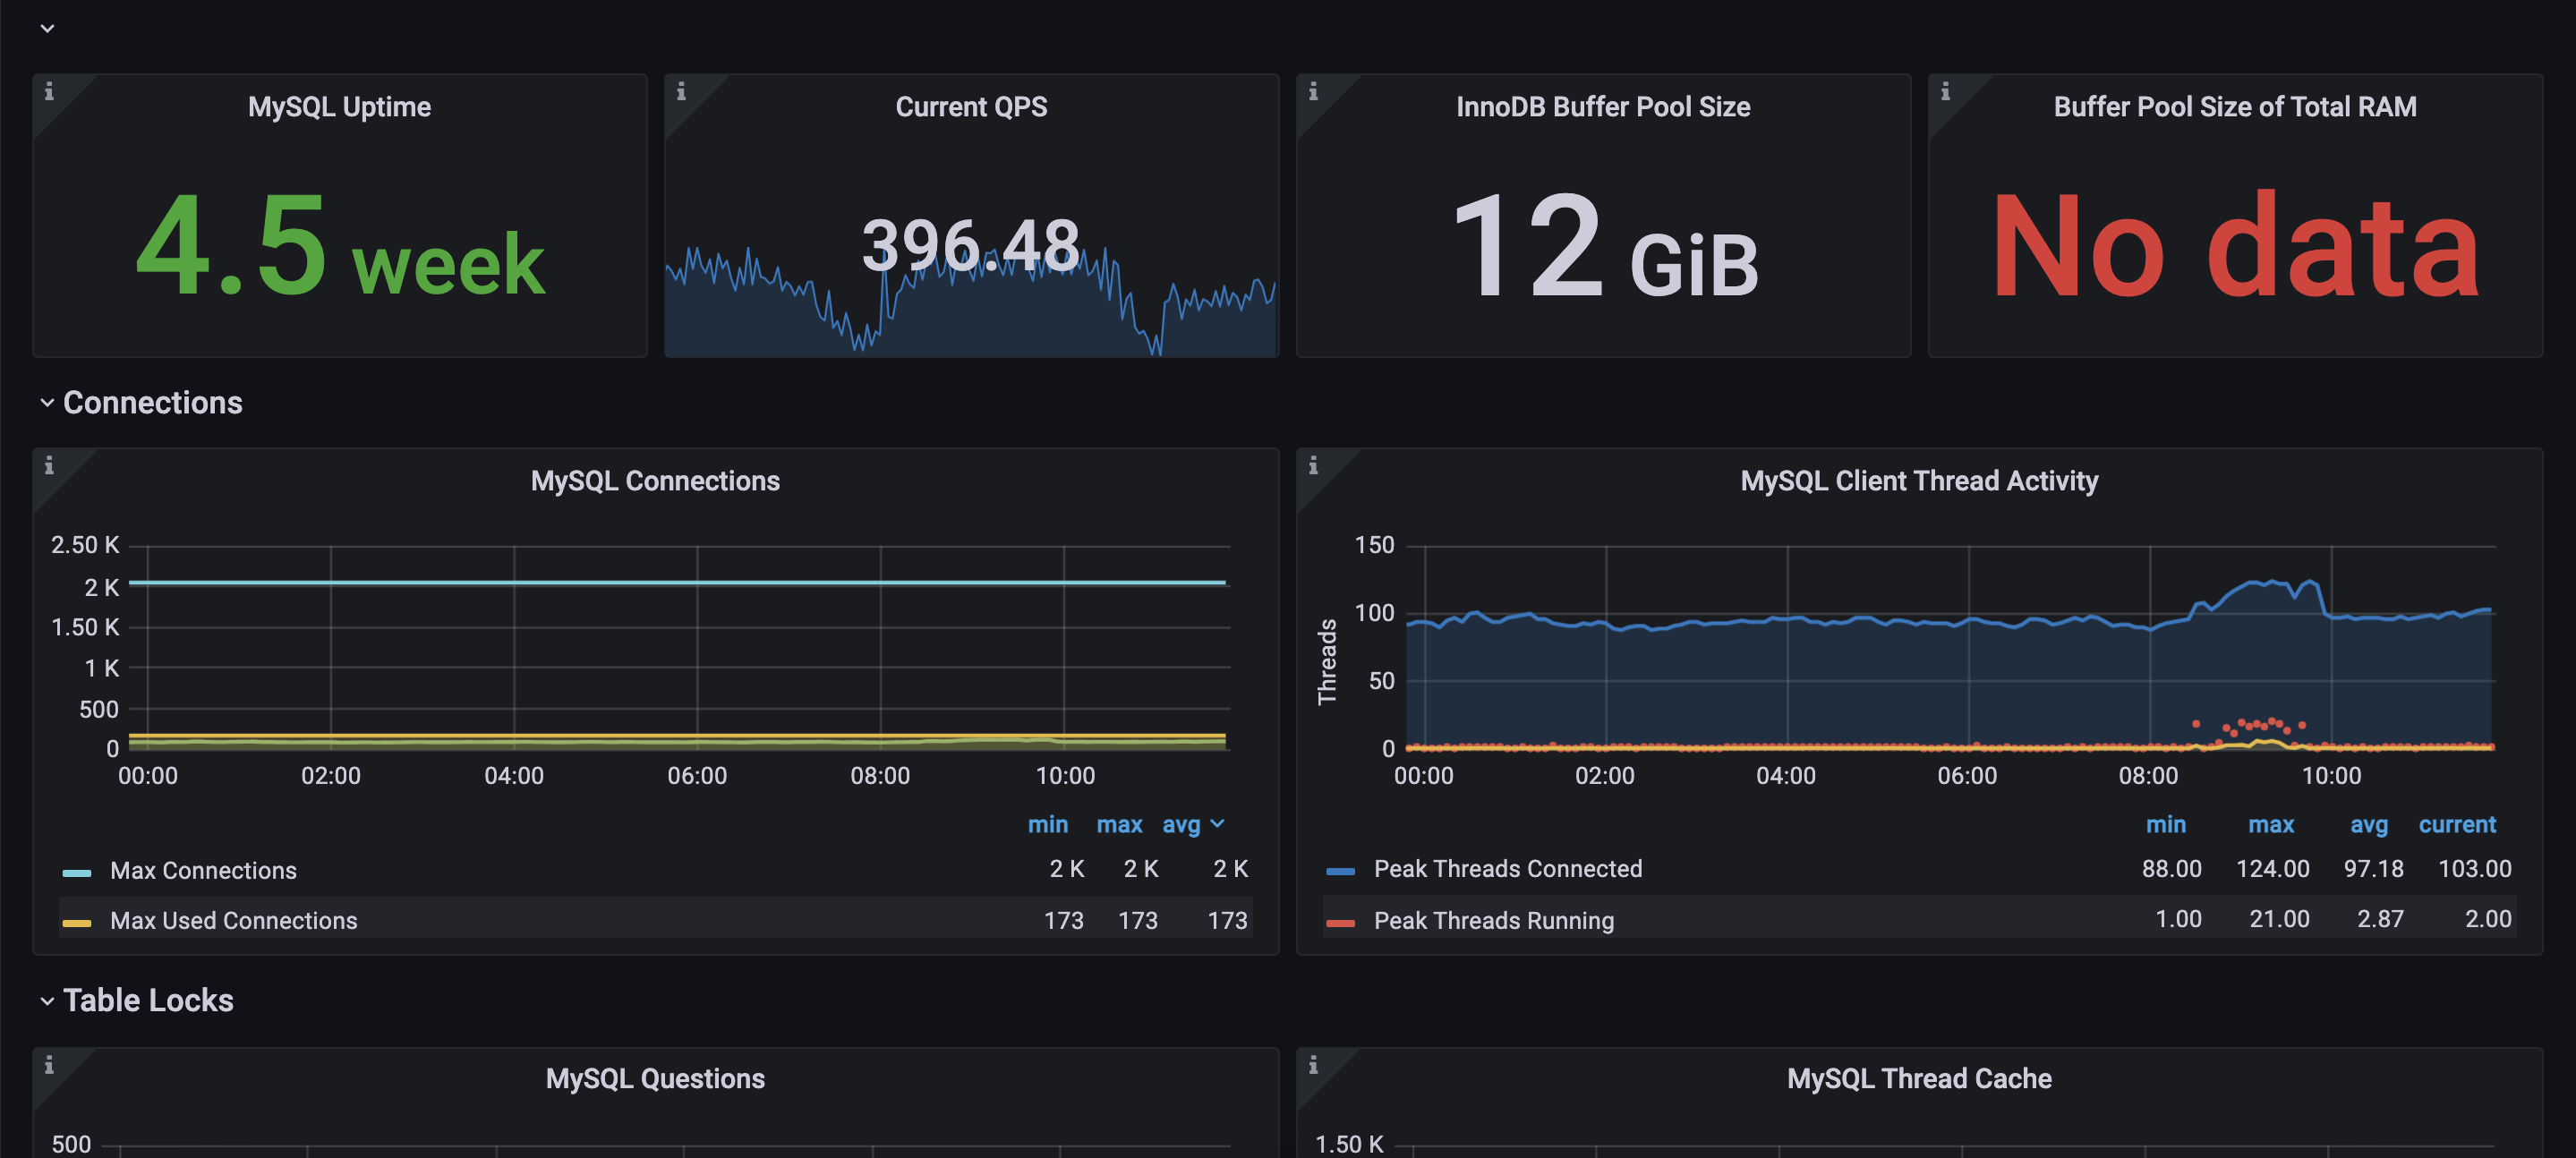
数据展示:


问题
什么是时序数据库?
时间序列数据库主要用于指处理带时间标签(按照时间的顺序变化,即时间序列化)的数据,带时间标签的数据也称为时间序列数据。
例如:InfluxDB 、 ElasticSearch 等
es存时序数据如下:
1 | { |